How to Test GPU Health and Performance in 2026
Remember the last time your game froze or your video editor crashed mid-project? These aren’t random glitches, they’re signs your GPU might need a health check. Your graphics card works like an engine, powering every pixel and frame you see. Without regular testing, even powerful GPUs can slow down, overheat, or fail when you need them most.
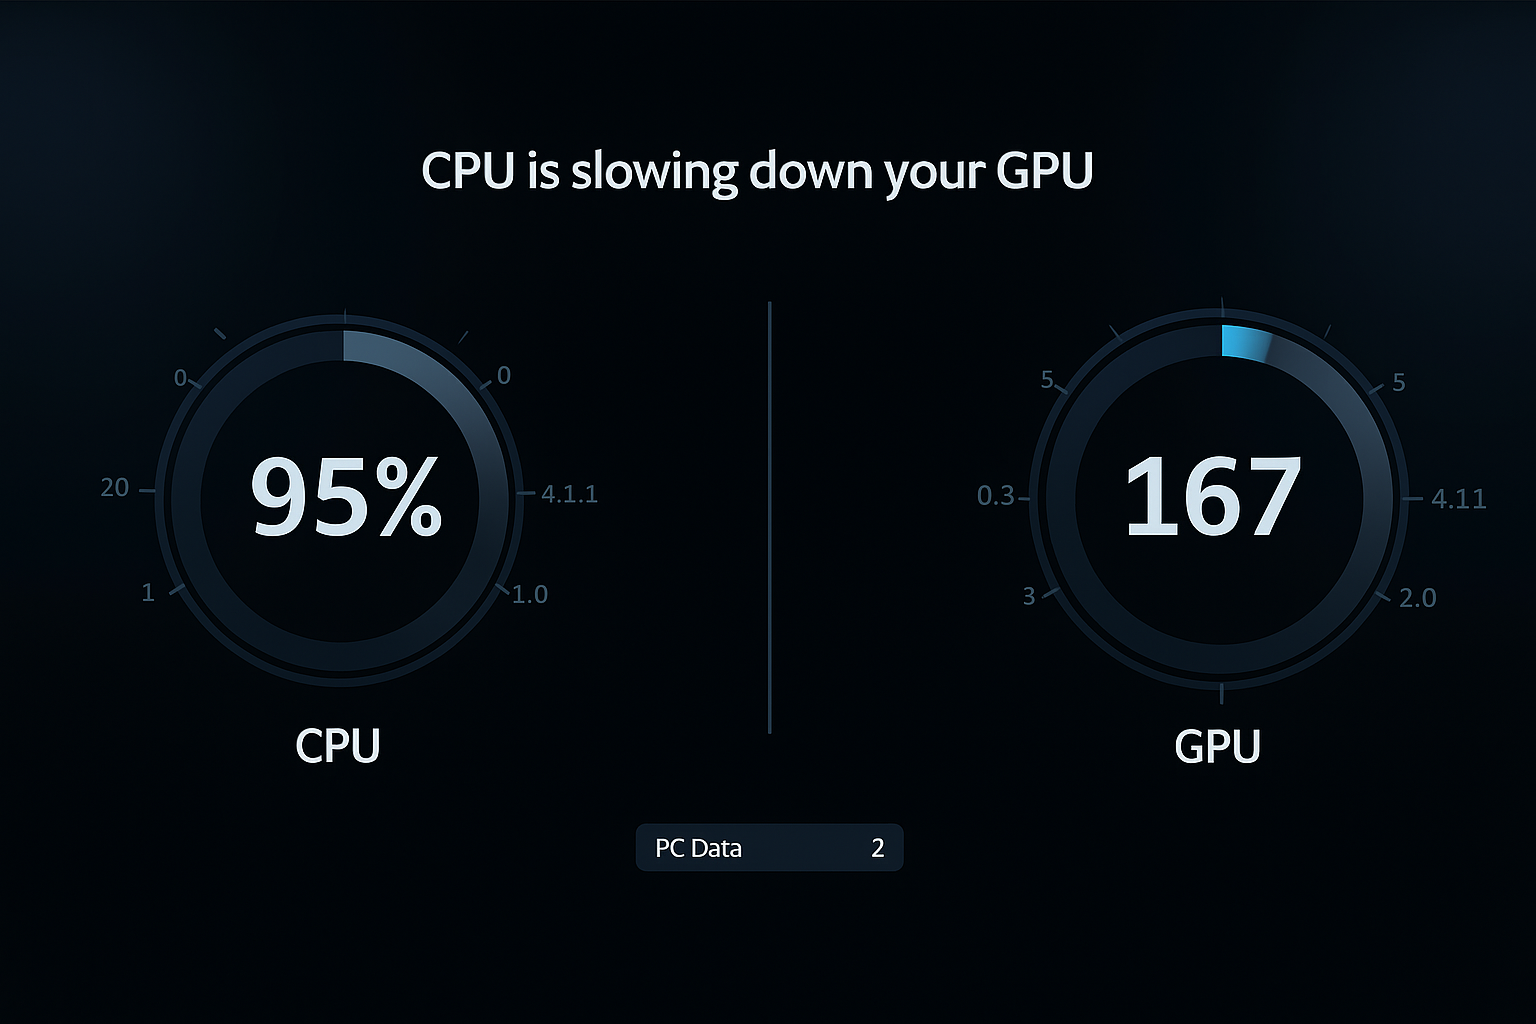
For overall system balance, it’s also important to use a PC Bottleneck Calculator to ensure your CPU and GPU are working efficiently together. Whether you’re a gamer, designer or everyday user, keeping your GPU optimized means smoother performance, fewer crashes, and a longer system lifespan. Let’s make sure your graphics card runs at full strength, stable, fast and ready for anything.
Understanding Your GPU and Its Role in System Performance
Your graphics processing unit (GPU) quietly powers everything you see on screen from scrolling through social media to streaming your favorite movie. This powerful piece of hardware acts as your computer’s visual translator, turning raw data into smooth, detailed images in milliseconds. A healthy GPU ensures sharp visuals, faster rendering, and lag-free performance, whether you’re gaming, editing or just browsing.
What is a GPU?
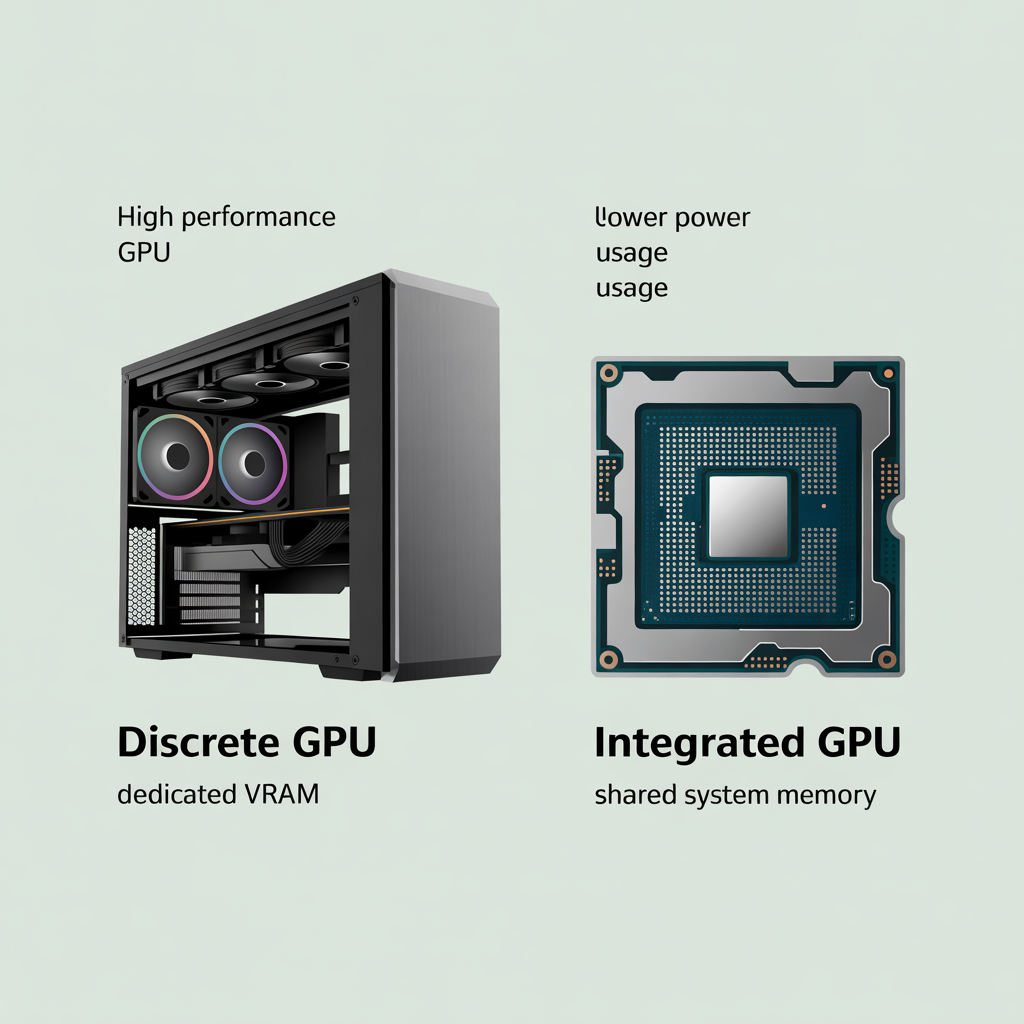
A GPU is the heart of your computer’s visual performance. Modern systems use two main types: discrete GPUs and integrated GPUs.
- Discrete GPUs are separate cards with their own memory and cooling perfect for gaming, 3D rendering, and video editing where high frame rates matter.
- Integrated GPUs, on the other hand, are built into the CPU or motherboard, offering smooth visuals for everyday tasks like web browsing, streaming, and office work.
Choosing between them depends on your needs: go discrete for power or integrated for efficiency.
Why GPU Health Matters for Optimal Performance
Keeping your GPU healthy is key to consistent performance and smooth visuals. When your graphics card runs efficiently, it prevents overheating, screen stutters, and sudden frame drops during games or editing sessions. Regular health checks can catch problems early from dust buildup and poor airflow to outdated drivers that quietly reduce your GPU’s power.
If you’re on a gaming laptop, proper cooling is even more important. Integrated GPUs can struggle with demanding visuals, while desktop cards need steady airflow to stay cool under load. Understanding how your hardware handles heat and performance ensures your system stays fast and stable. Choosing a well-balanced setup also matters, so exploring the best CPU and GPU combo can help you avoid performance bottlenecks and maximize efficiency.
How to Test GPU Health and Performance
Your computer’s true visual power is just a few clicks away, hidden within built-in Windows tools. These native features let you uncover key information about your graphics hardware from GPU type to driver performance. By learning where to look, you can quickly understand your system’s visual health and take smarter steps to maintain it. Let’s explore these built-in tools that turn every user into a confident PC expert.
Quick Health Checks Through System Tools
You can perform fast GPU health checks right from Windows without extra software. Press Win+I to open Settings, then go to System > Display > Advanced display settings. Under Adapter properties, you’ll see your graphics card’s vital stats. A “Device working properly” message confirms that your GPU passes the initial inspection.
For deeper insights, open Device Manager by right-clicking the Start menu and selecting Display adapters. Here, you can review your GPU’s properties, check driver versions, and spot potential hardware conflicts that simple checks might miss. Regularly using these tools helps maintain optimal graphics performance and prevents unexpected crashes.
Real-Time Performance Tracking Made Simple
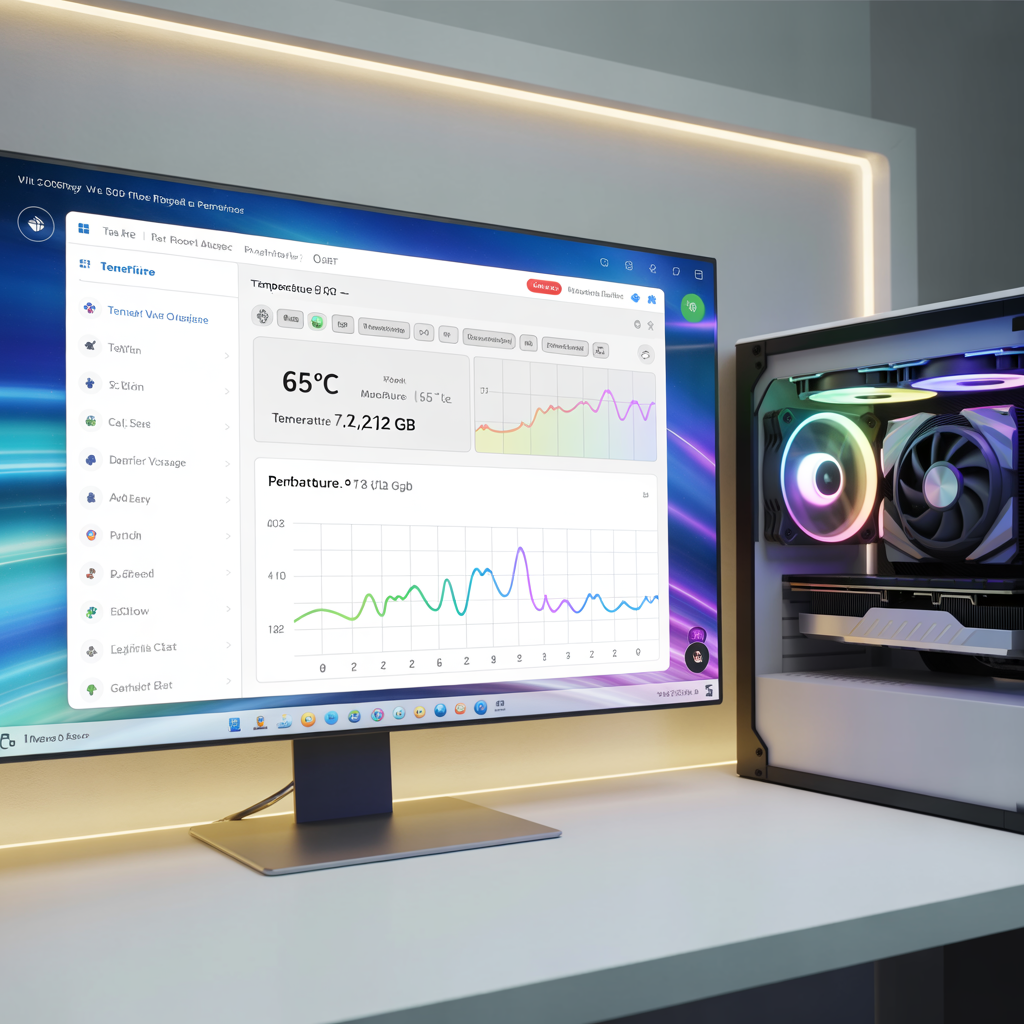
Monitoring your GPU health and performance in real time is easier than you think. Start by opening Task Manager and navigate to the Performance tab. Here, live metrics such as GPU memory usage, temperature, and load spikes are displayed.
Keep an eye on these numbers while running graphics-intensive apps sudden drops in performance or visual glitches may indicate early signs of a struggling GPU. Consistently high temperatures can also signal cooling problems or hardware issues.
For a deeper look, use the DirectX Diagnostic Tool: press Win+R, type dxdiag, and check the Display tab for driver versions and detected issues. Combining this with Task Manager readings gives a clear picture of your GPU’s stability and cooling efficiency.
Quick Tool Comparison
| Tool | Best For | Key Metric | Ease of Use |
|---|---|---|---|
| Windows Settings | Basic GPU status | Device status | ★★★★☆ |
| Device Manager | Driver diagnostics | Error codes | ★★★☆☆ |
| Task Manager | Live monitoring | Temperature & load | ★★★★★ |
| DirectX Tool | Technical details | Driver version & issues | ★★★☆☆ |
Regularly tracking these metrics establishes a simple maintenance routine, helping you spot minor irregularities early and prevent performance issues before they become critical. Your GPU will thank you with smoother graphics and reliable performance.
Interpreting GPU Test Results and Maximizing Performance
Your graphics card metrics reveal a hidden language of performance peaks, temperatures, and memory usage. Understanding this “GPU vocabulary” allows you to extract maximum performance while protecting your hardware investment. Let’s turn raw numbers into actionable insights you can trust.
Visualizing Your GPU’s Vital Signs
Modern tools provide dashboards displaying real-time GPU utilization, temperature, power consumption, clock speeds, and VRAM usage. Interactive charts and 3D hardware models let you visualize your card’s health, making complex data simple to interpret. By monitoring these metrics, you can optimize performance without risking stability.
Key Metrics to Monitor
- Temperature: Keep below 85°C for safe gaming sessions.
- Clock Speeds: Maintain above base MHz to ensure your GPU is operating efficiently.
- FPS Drops: Consistently below 60? Adjust display settings or update drivers.
- VRAM Usage: Stay under 90% to prevent texture loading issues.
Smart Optimization Techniques
- Match resolution to GPU capability (1080p often performs better than 4K on mid-range cards).
- Regularly update drivers from manufacturer sites to unlock hidden performance potential.
- Adjust graphics settings for a balance between smooth frame rates and visual quality.
Advanced Configuration Secrets
Windows graphics preferences, Nvidia Control Panel, and AMD Adrenalin Software allow granular control over anti-aliasing, texture filtering, and performance priorities. Use these tools to fine-tune your GPU for stable, high-quality visuals.
Quick Reference Table
| Metric | Ideal Range | Recommended Action |
|---|---|---|
| Temperature | 60–80°C | Improve cooling |
| Clock Speed | Base + Boost | Update drivers |
| FPS | 60+ | Lower resolution / tweak settings |
| VRAM Usage | <90% | Reduce texture quality |
| TDP | Manufacturer spec | Check PSU |
Pro Tip: Maximum graphics settings don’t always mean the best experience. True optimization comes from finding the sweet spot where visual quality meets stable frame rates. Let your GPU health metrics guide every decision, they act like a trusted co-pilot for superior performance.
Conclusion
Maintaining your GPU health and performance is no longer optional, it’s essential for smooth gaming, flawless video editing, and lag-free everyday computing. From quick system checks in Windows to real-time monitoring with Task Manager and DirectX Diagnostic Tool, every metric tells a story about your graphics card’s capabilities. Understanding temperatures, clock speeds, VRAM usage, and FPS patterns empowers you to make informed tweaks that protect your investment and maximize performance.
Regular monitoring and optimization turn a standard GPU into a powerhouse, capable of handling demanding applications without overheating or stuttering. Leveraging built-in tools, driver updates, and advanced settings in Nvidia Control Panel or AMD Adrenalin Software ensures your visuals stay crisp, your frame rates stable, and your workflow uninterrupted.
Remember, true graphics mastery isn’t about pushing settings to the max, it’s about finding the sweet spot where performance, stability, and visual quality align. By following the steps in this guide, you’re not just testing your GPU; you’re unlocking its full potential, extending its lifespan, and guaranteeing a smooth, responsive computing experience for years to come.
Keep your GPU healthy, monitor it consistently, and let every frame, every render, and every pixel shine at its absolute best.